 Automation-friendly framework for Continuous Testing


 Automation-friendly framework for Continuous Testing
How to Easily Run Taurus with BambooBy: Yuri Bushnev, May 2017 Why Use Taurus with CI toolsContinuous Integration (CI) is a way to automate our tests and make the test process itself easier and more productive. With the help of CI it takes much less time to release, build, deploy and run tests automatically on a daily basis. At the same time, most performance testing tools are not well-designed for a smooth CI pipeline integration. By using Taurus, an open source automation testing framework, combined with some continuous integration tools like Bamboo, we can achieve outstanding results in automation of our performance gates. An Introduction to TaurusTaurus is an open source automation framework that provides the ability to create test performance scripts from scratch or use existing scripts, and to configure run options. These options include many features that help execute and analyze script results. The main idea behind the Taurus framework is that the script creation/configuration language is more user-friendly than options provided by other testing tools. Taurus, with its YAML-based syntax or JSON languages, helps you generate scripts in Apache JMeter™, Gatling and additional tools. There are many additional advantages:
The installation of Taurus is very straightforward and should take just a few minutes by using the Taurus: Installing and Upgrading guide. An Introduction to BambooBamboo is a continuous integration server developed by Atlassian. It provides automated deployment, building and testing capabilities and built-in integration with other Atlassian products like Jira or Confluence. Because Jira is the most popular bug tracking tools, Bamboo is one of the most popular CI systems that is used in many companies over the world. For more information, see also the official Bamboo installation documentation. Running Taurus with BambooIn this scenario, we use the following workspace:
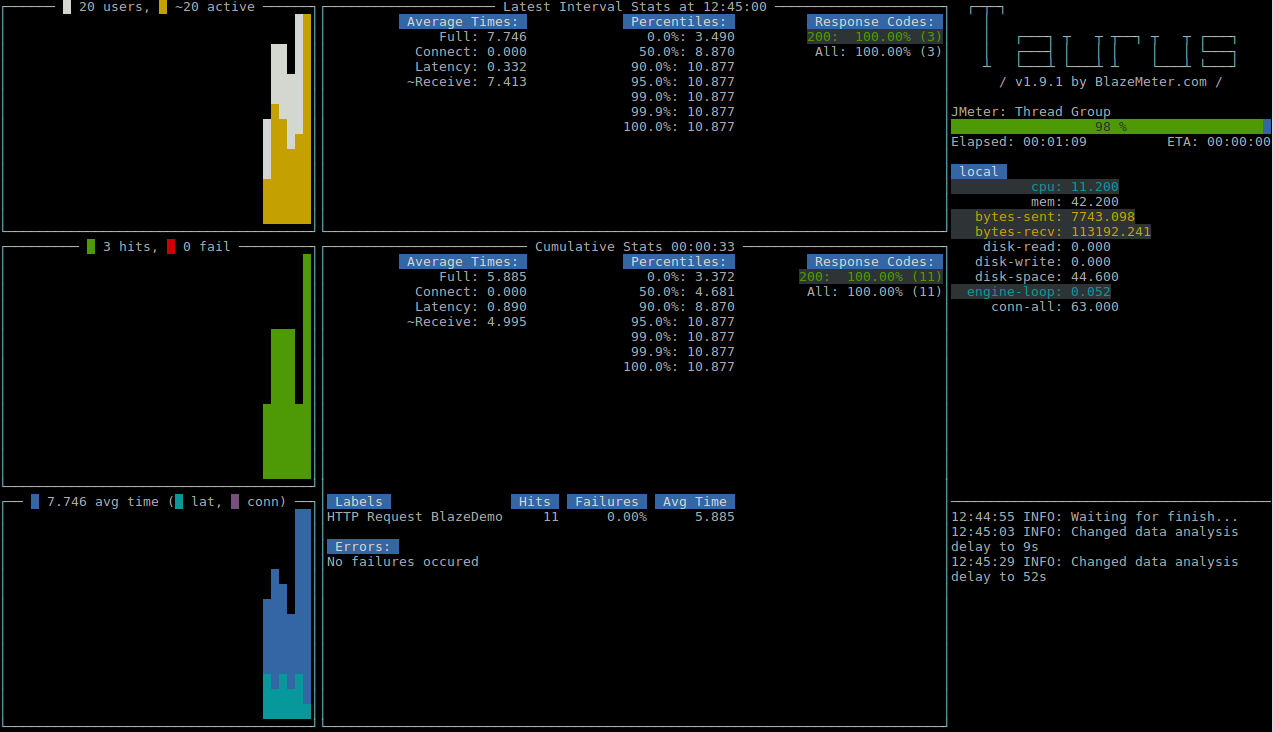
First, let’s create a simple YAML script named “script1.yml” execution: - concurrency: 20 hold-for: 1m ramp-up: 10s scenario: Thread Group scenarios: Thread Group: requests: - label: HTTP Request BlazeDemo method: GET url: http://www.blazedemo.com/ As you can see, Taurus script files are human-readable. In the provided example we simulate simple get requests to blazedemo.com from 20 different users for 1 minute. Ramp-up means the onboarding time for all users, and the hold-for parameter means that the target load is held for 1 minute. Taurus uses JMeter as a default test executor, but you can choose different executors: Selenium, Gatling, Locust, etc. To run that script using Taurus, execute the following command: bzt script1.yml During test execution, watch the real-time dashboard in the console for lots of useful metrics:
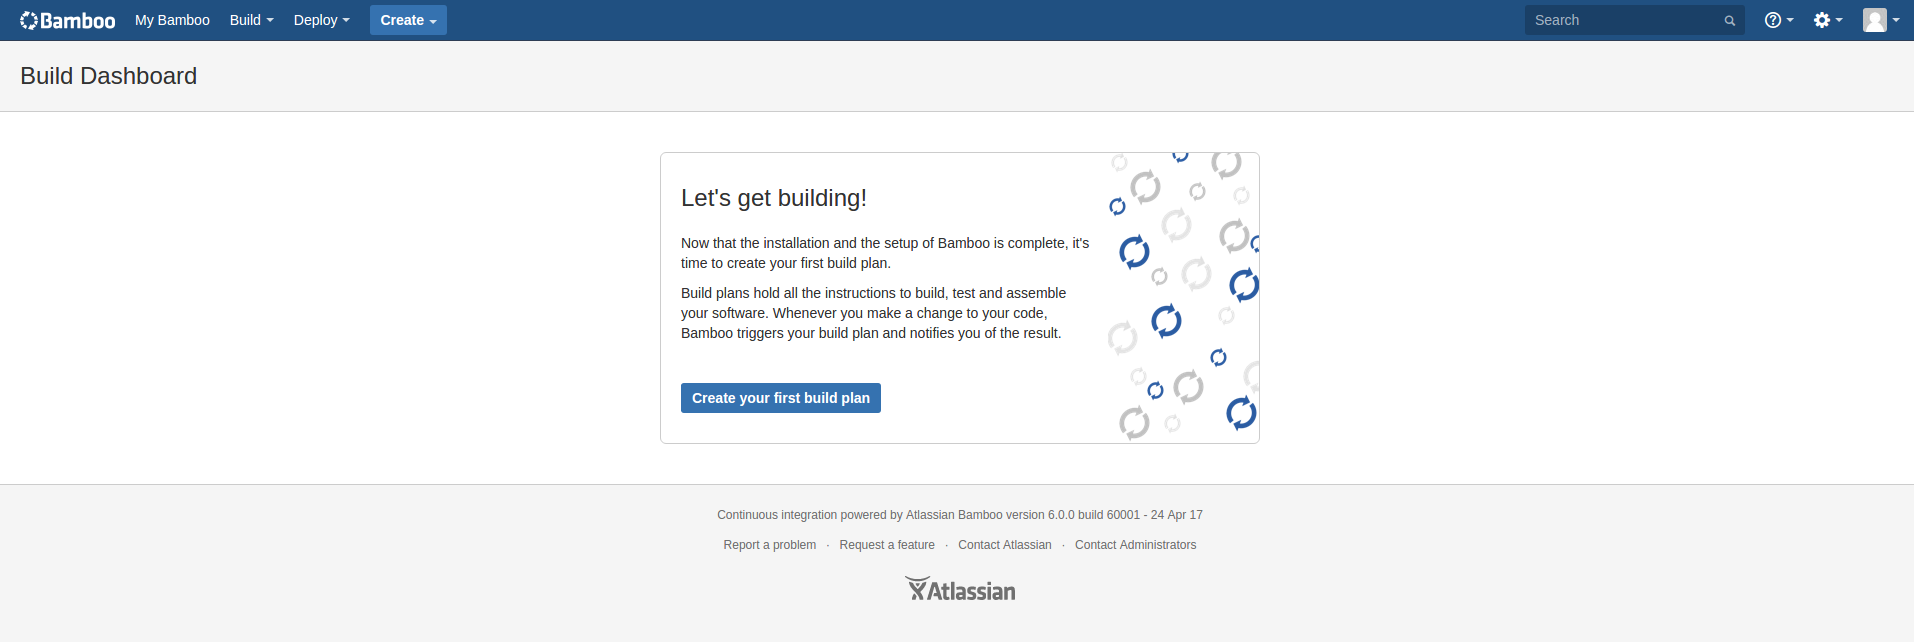
If there are any errors, we see them in the right upper corner. In the middle of the dashboard, we see such test parameters as latency, the requests’ response codes, errors, etc., which are necessary to know during and after the test run. Next, install Bamboo on your computer and make it available on a URL, such as http://localhost:8085/ in our case. If you open Bamboo for the first time, you will see the Start window.
If you’re running Bamboo for the first time, click the “Create your first build plan” button. Otherwise, click on the Bamboo main menu panel “Create -> Create a new plan” to create a new test plan and follow the steps below:
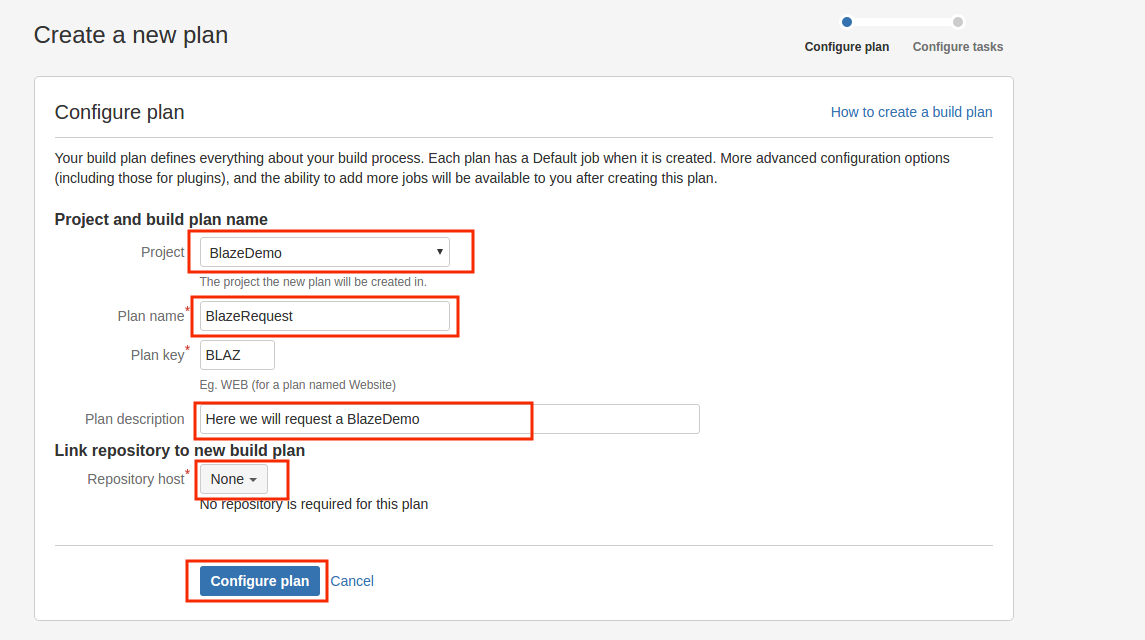
Here, specify your project parameters.
After configuring these parameters, click the “Configure plan” button. Next, you’ll see a “Create a new plan” window:
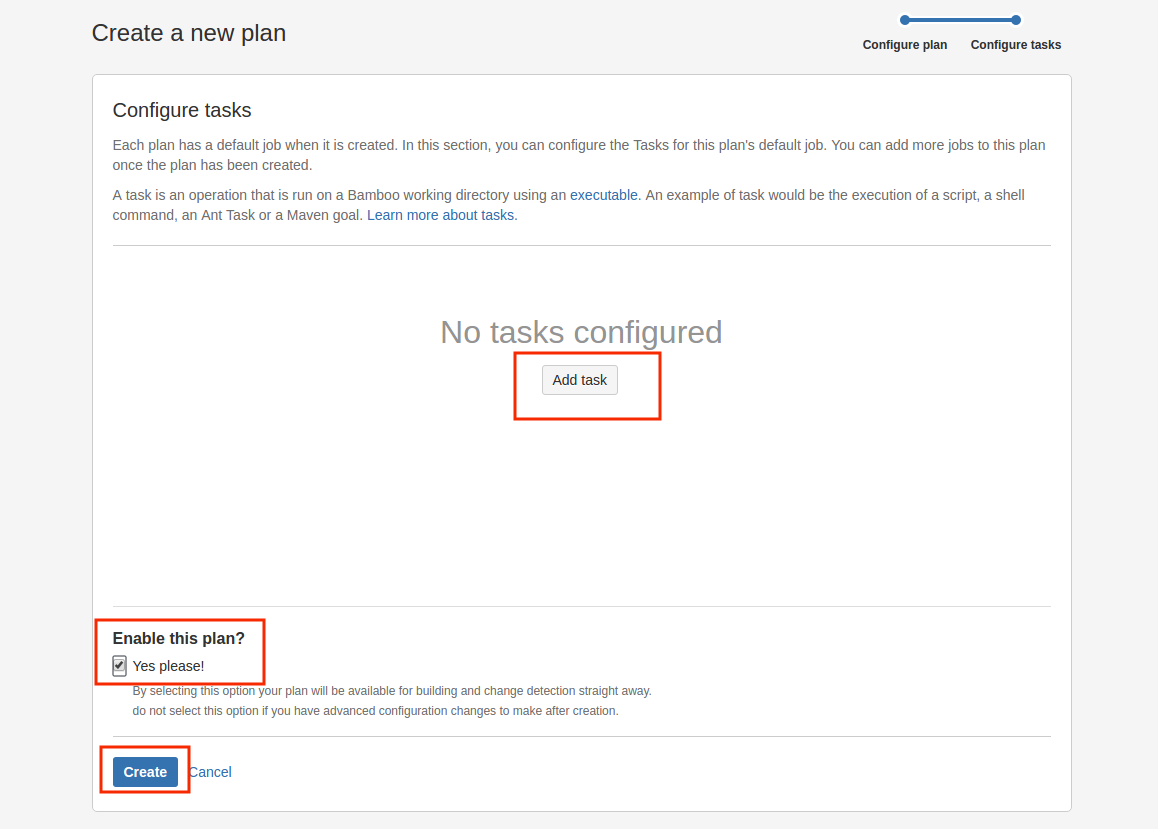
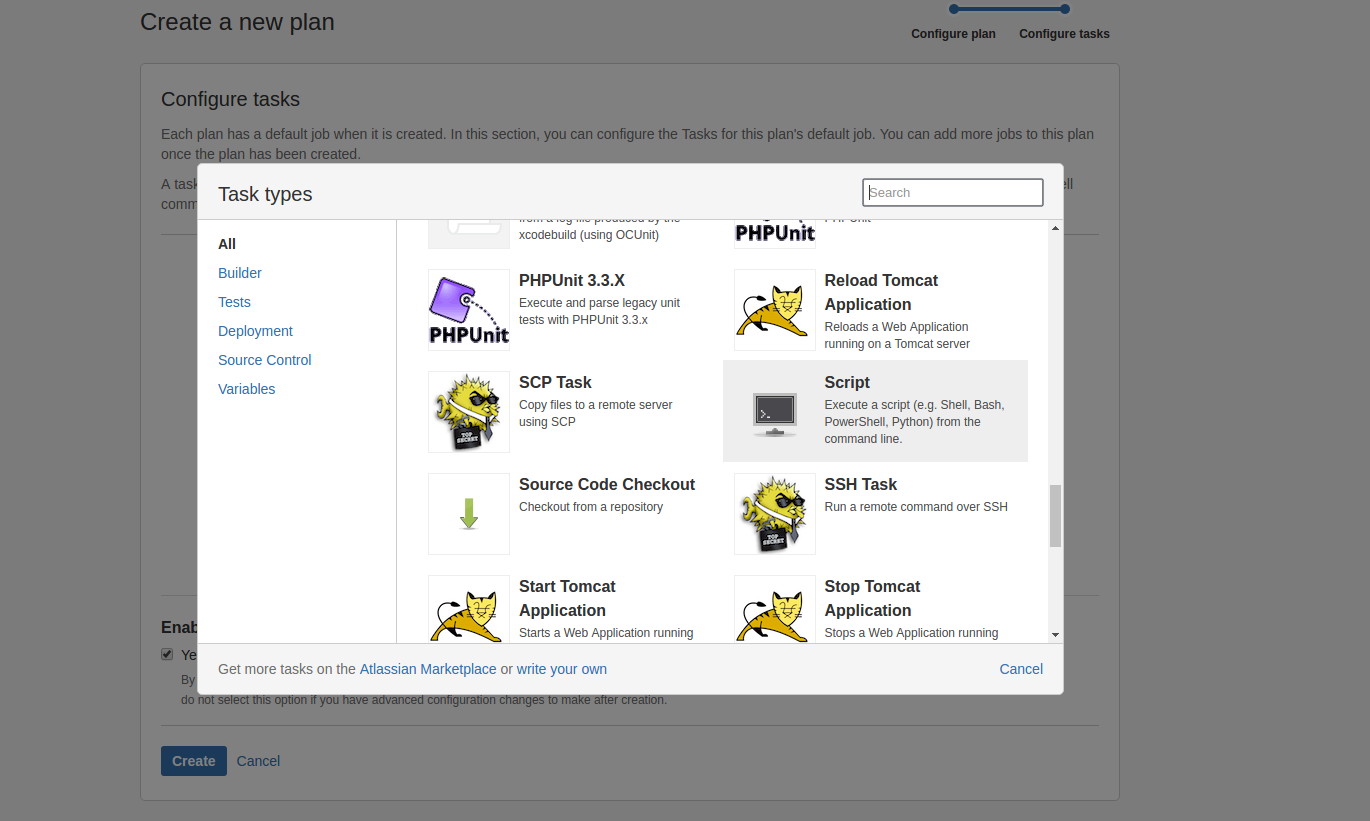
Here you should check the “Yes, please” CheckBox to enable your test plan, so you can configure and run it. Next, press the “Add task” button to add a new task to your test plan. You’ll see a window like this:
Here, the user is asked what type of task should be used. In the "Task types" window, choose "Script" type.
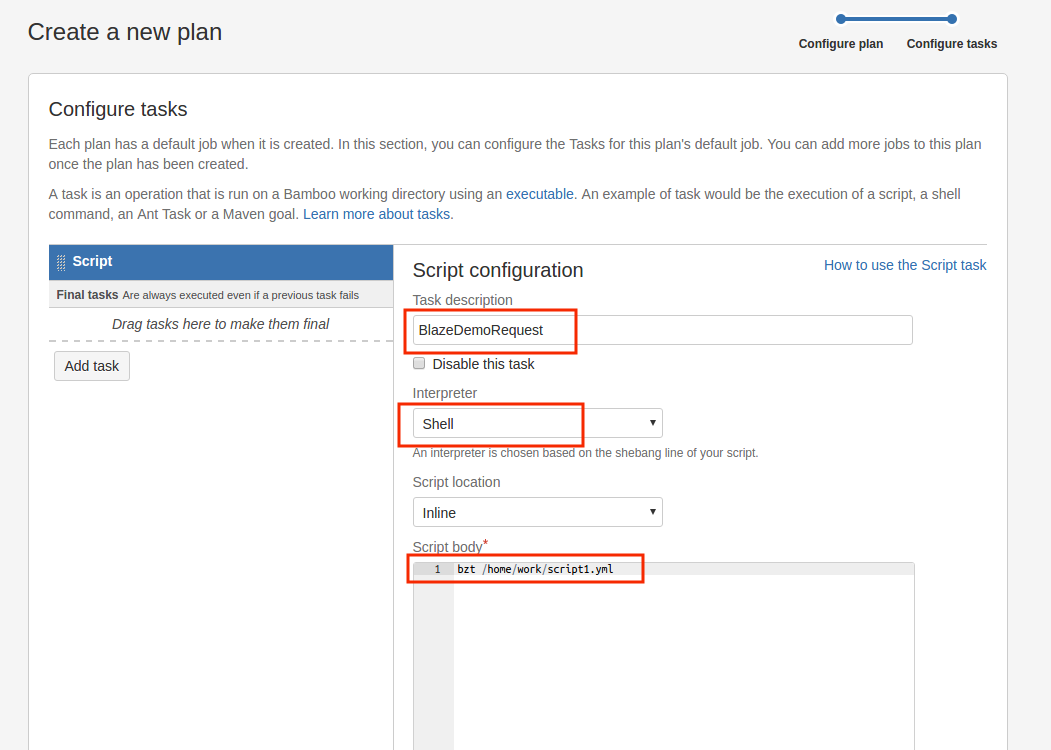
Enter the Task description and choose a command interpreter depending on our OS architecture (“Shell” for Linux, “Windows PowerShell” for Windows, “bin/sh or cmd.exe” as universal option). In the “Script body” field, type: bzt /{path_to_yml_script}/script1.yml
After this, click the “Add task” button and click the “Create” button to finish your test plan creation.
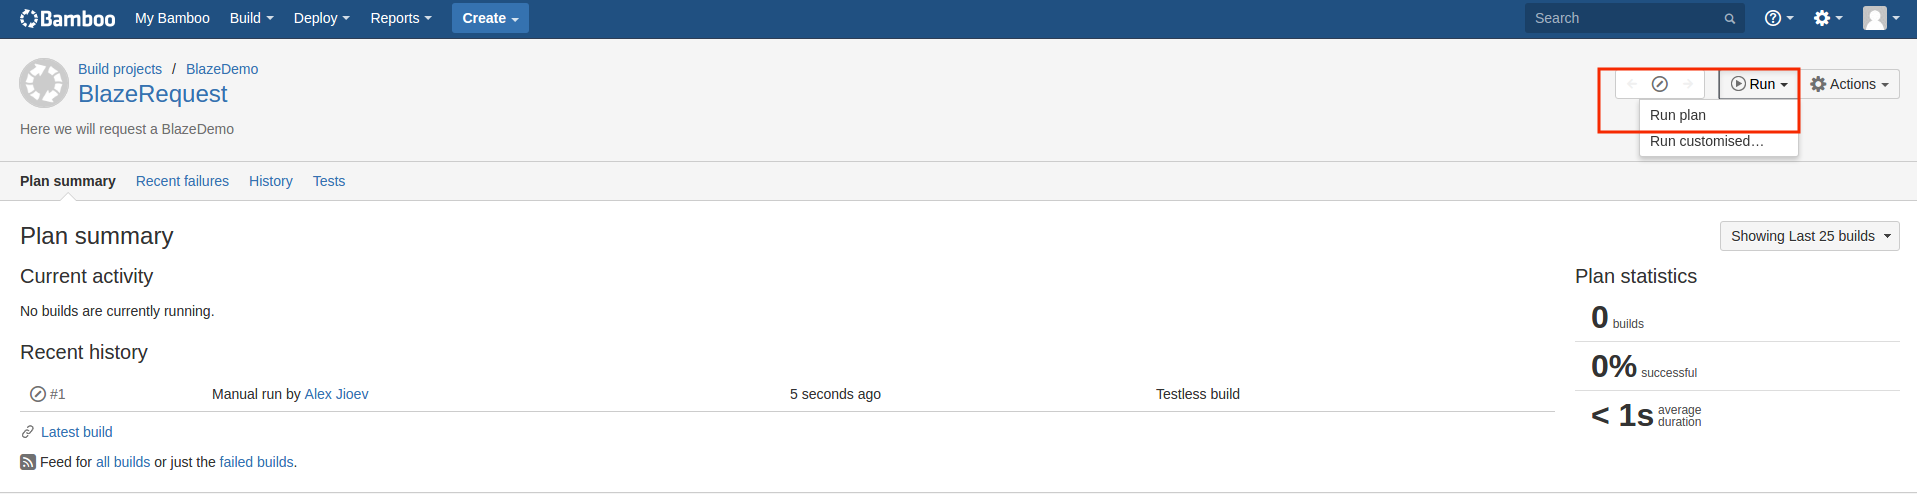
In the newly opened window, click “Run” -> “Run plan” to execute your test plan. That’s it! Your performance test is up and running.
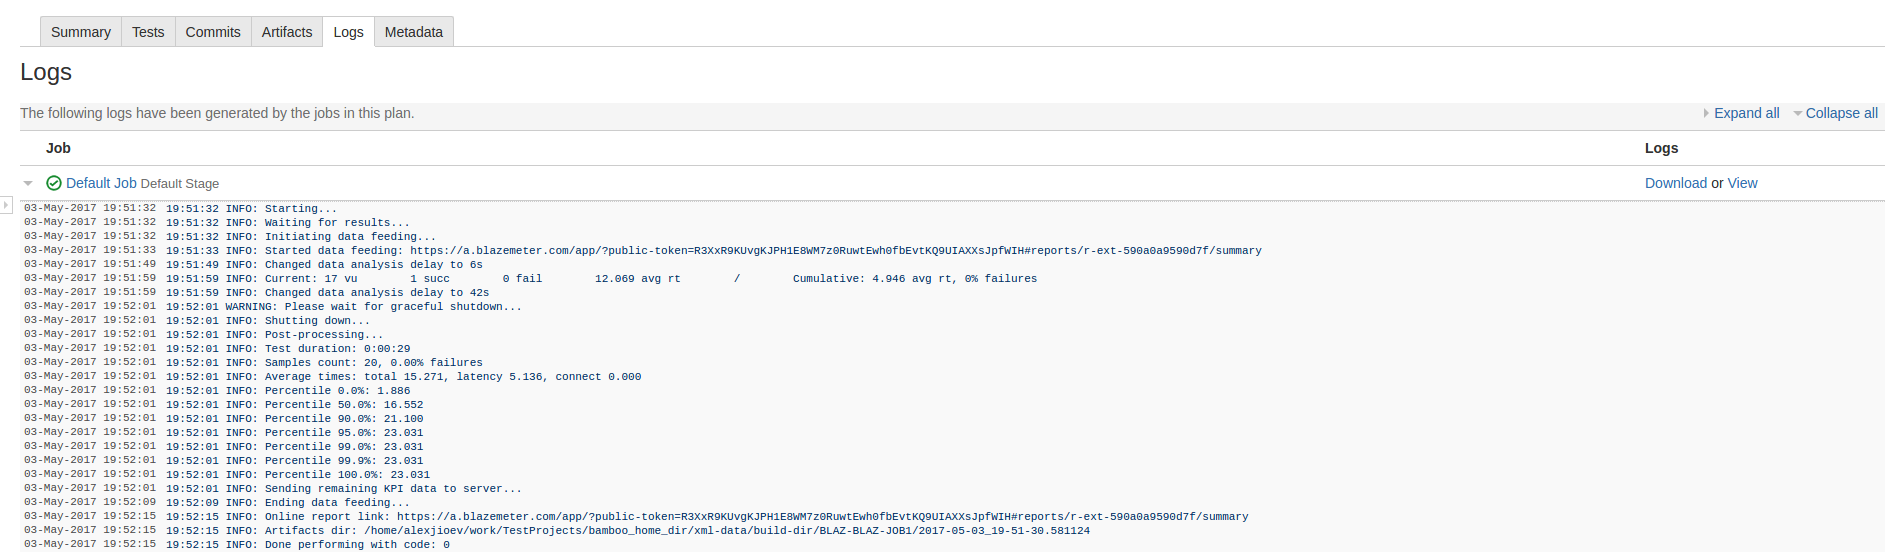
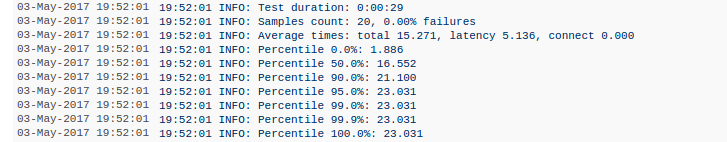
ReportingAs soon as your test is finished, you’ll see performance metrics results at the end of the log file in your finished build run.
If you take a look at the mentioned log’s lines, you see parameters such as test duration, latency, samples count, and response time. But, of course, reading metrics from logs is not the best option. That’s why Taurus provides a better test analysis. Through Taurus, you can easily view, analyze and collect all performance metrics: through the Blazemeter app. To do so and to see your tests results, change the command in the “Script body” field to: bzt /{path_to_yml_script}/script1.yml -report
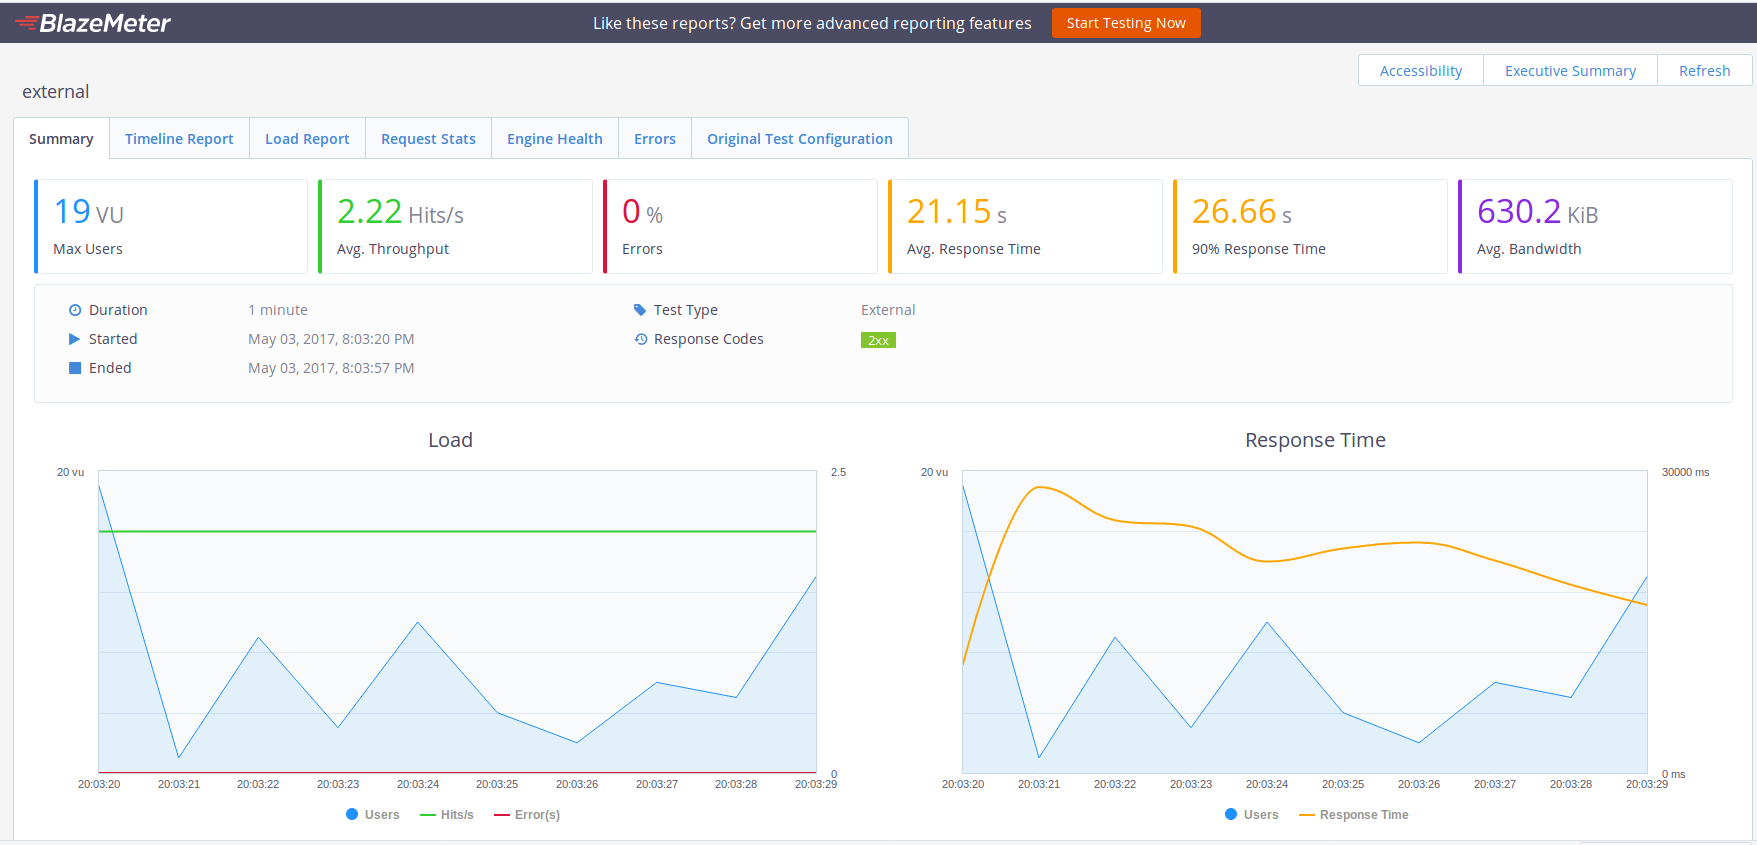
The “-report” command runs a BlazeMeter reporter. It uploads your test to the BlazeMeter app, which contains everything you need to get as much as possible from your performance metrics. Taurus feeds results to the server, so you don’t need to provide any additional configuration. You receive the report link in the console text. This link is automatically opened in the browser, and you will see the web application with your test execution:
BlazeMeter reporting provides the ability to see various parameters of the running test. You can find all necessary information about time (duration time, response time, latency, etc.), loading and request stats, information about errors, response codes and many other helpful parameters that let you analyze your test more deeply and fuller. That’s it! Now you are able to run Taurus YAML test scripts via the Bamboo CI tool. |
On this page:
|