 Automation-friendly framework for Continuous Testing


 Automation-friendly framework for Continuous Testing
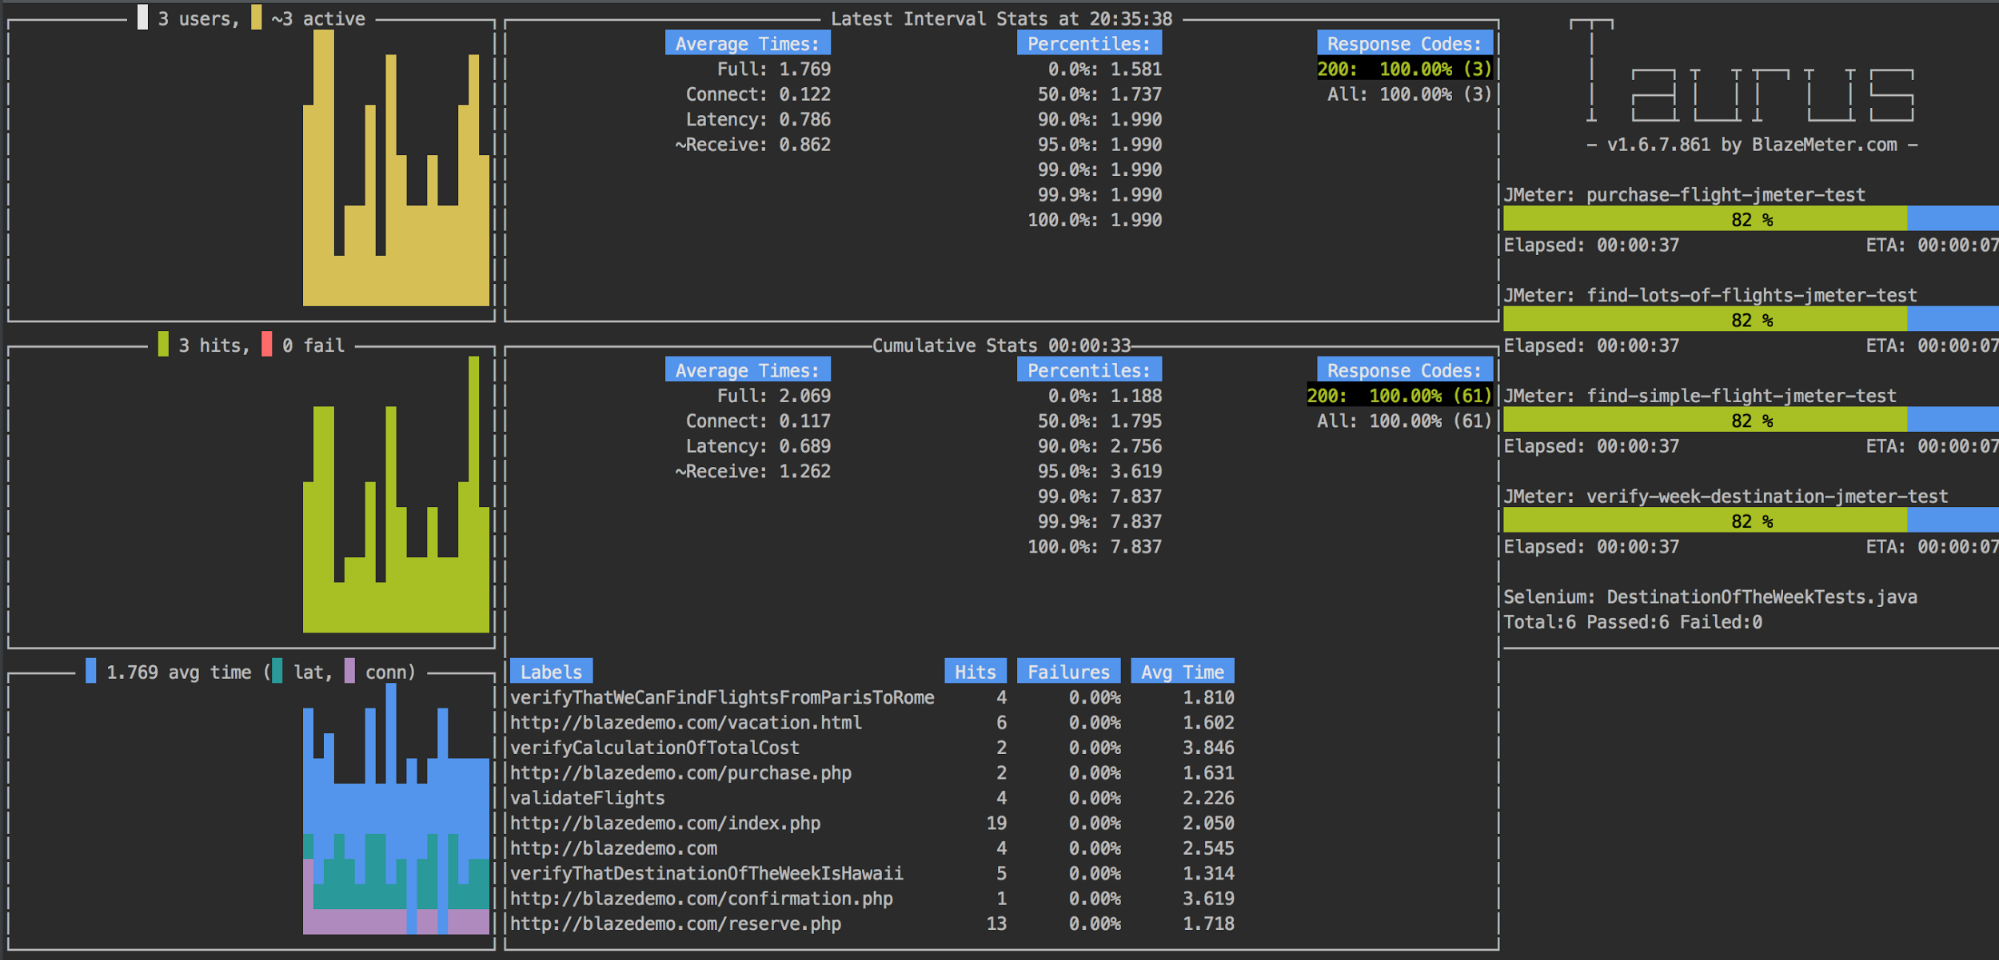
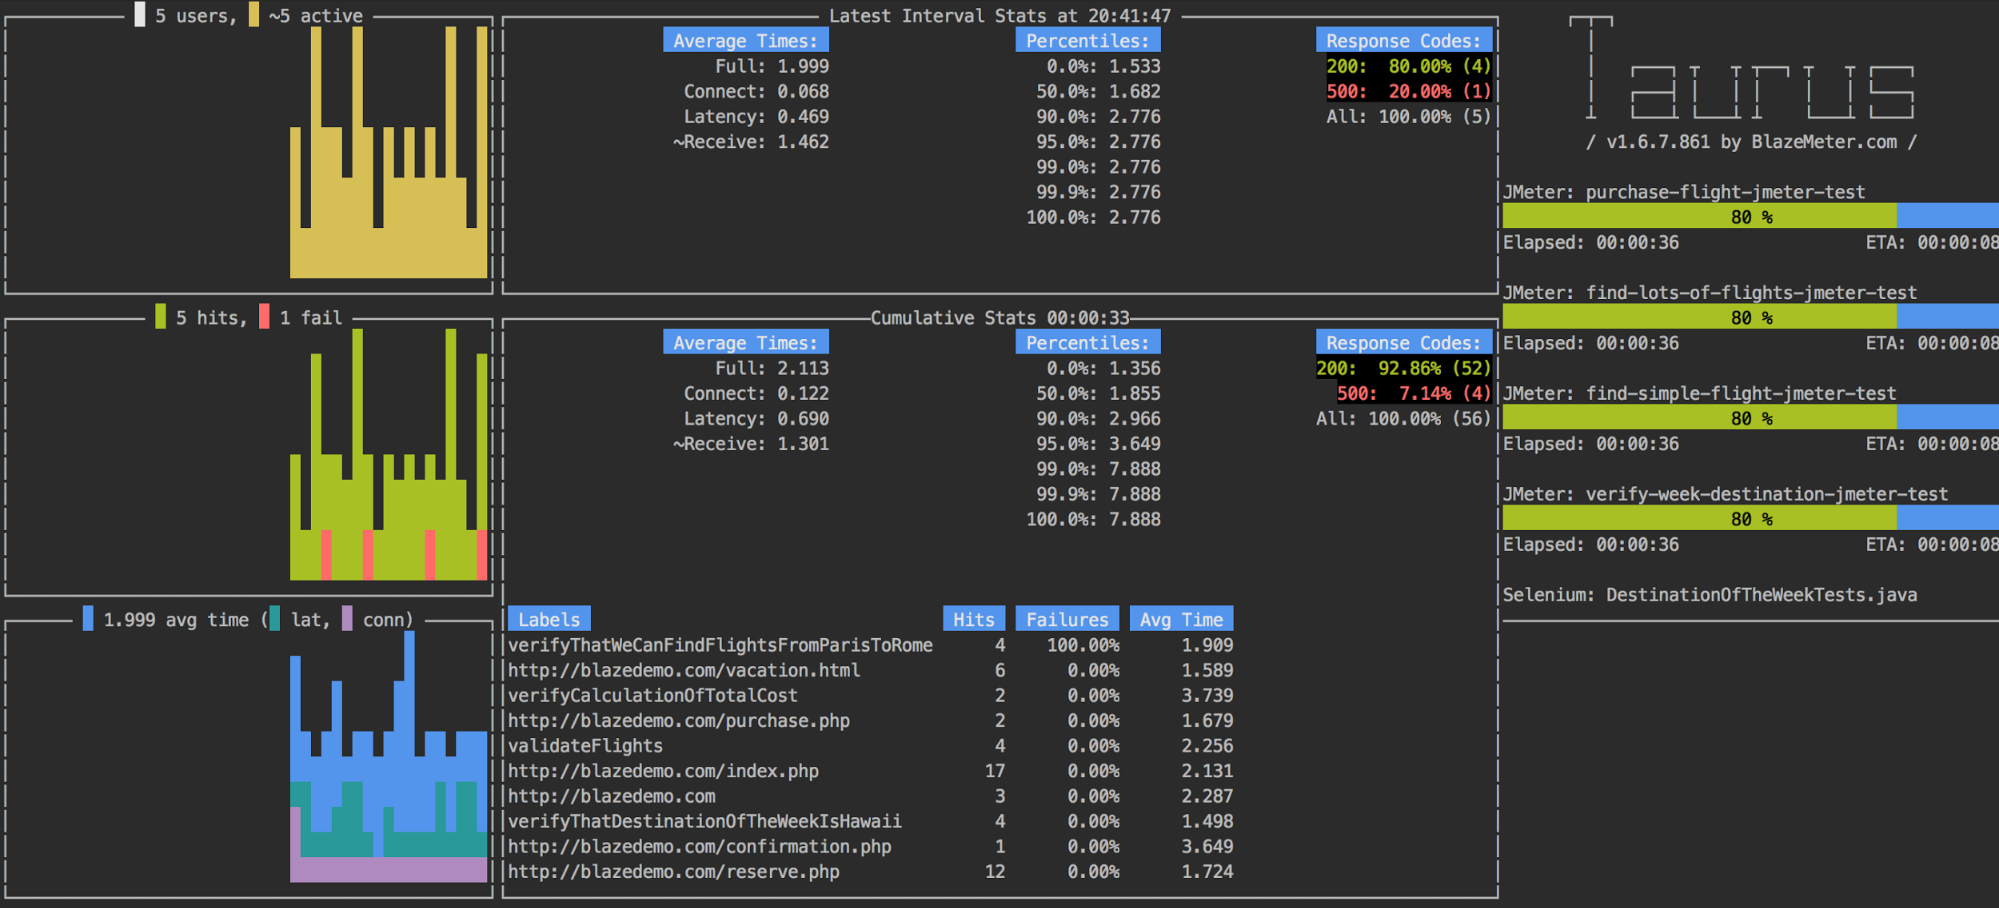
Reporting and Results Analysis on TaurusAuthor: Iurii Bushnev Welcome to part 2 of our “Continuous Functional and Performance Test Automation with Selenium, JMeter and Taurus” series. In the previous article, we covered how to create Taurus scripts from scratch, without direct use of Selenium and JMeter. In this article, we will go over how to view and analyze reports. Taurus is a tool that provides a simple way to create and run performance tests, as well as an easy integration with additional open-source functional and performance testing software, like Selenium, JUnit, Gatling or JMeter. Taurus also provides great ways for results reporting and analysis. The default way is Console Reporting. With console reporting, you can just run your test. The results are detailed and even more importantly - they are also in real-time. The metrics are self-explanatory and provide lots of information.
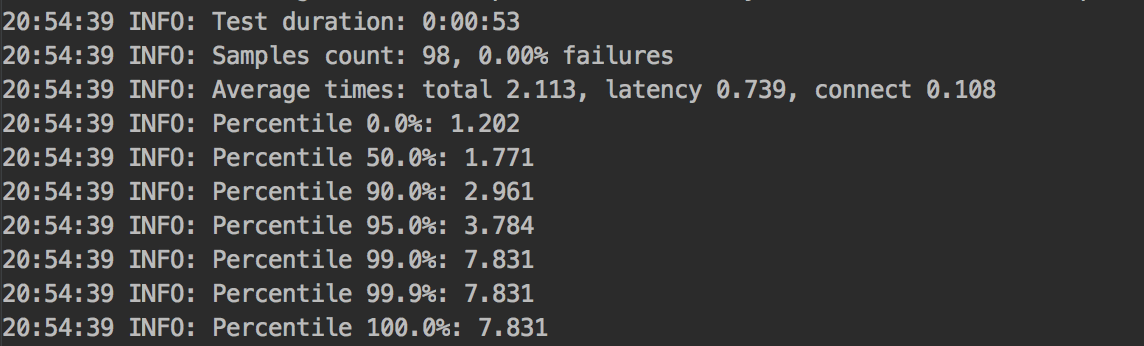
Another option is final statistics reporting. This reporting provides the basic metrics in the console after test execution. This report can also be tuned according to your needs. For example, you can specify a ‘dump-csv’ file for creating graphs by using Jenkins. In that case, the reporting section will look like this: reporting: - module: console - module: final-stats summary: true # overall samples count and percent of failures percentiles: true # display average times and percentiles failed-labels: false # provides list of sample labels with failures test-duration: true # provides test duration dump-csv: TaurusResult/perf_result_csv.csv The results produced by the test execution will look like this:
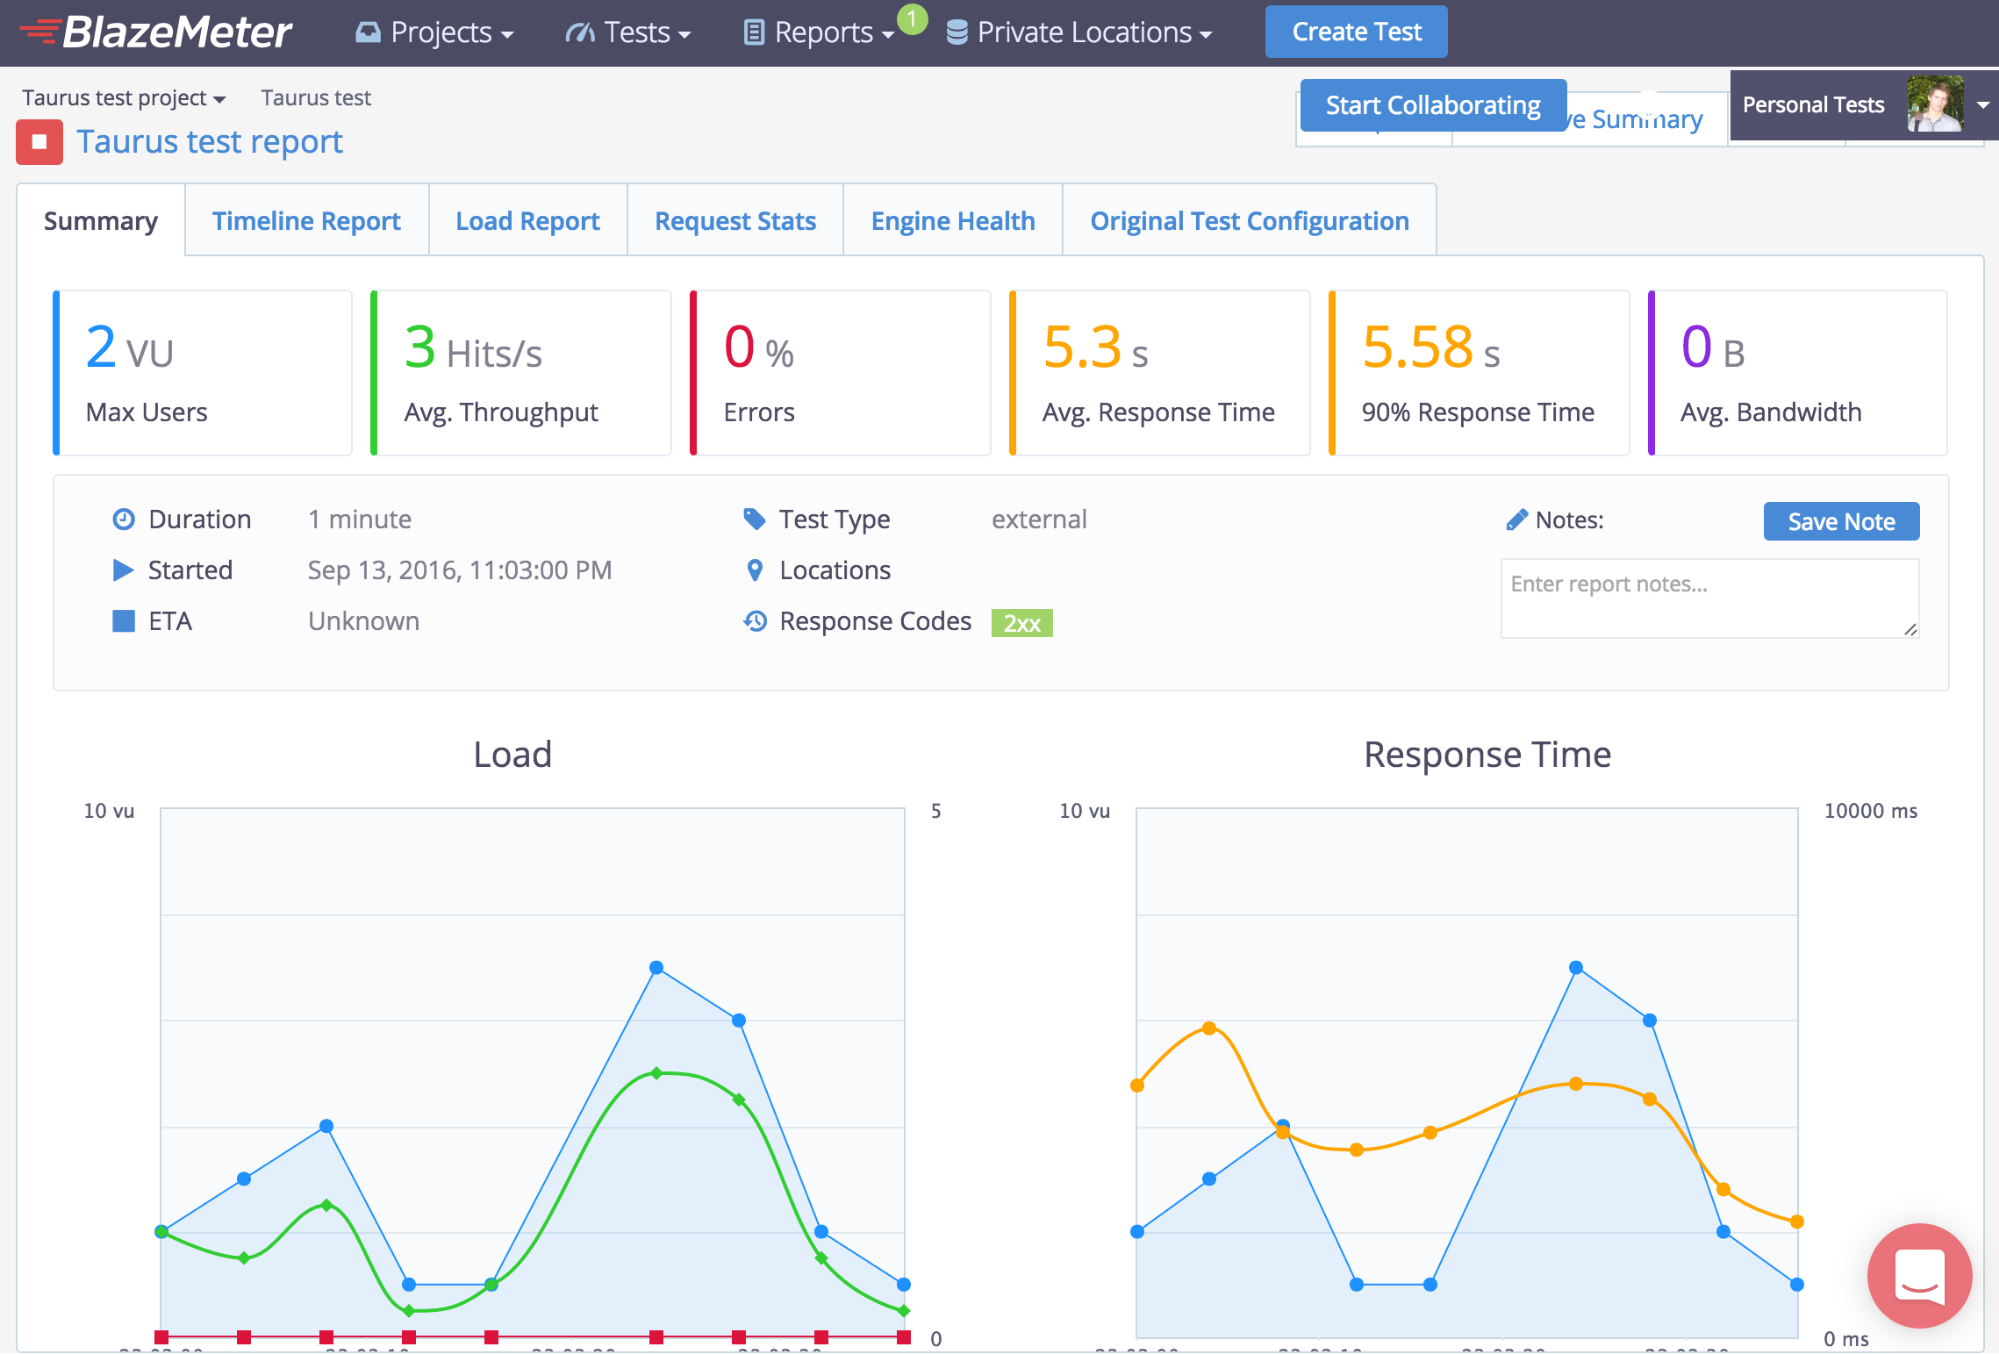
Since Taurus also covers functional tests with Selenium, we recommend you provide pass-fail statistics. Taurus currently supports the ability to generate the JUnit xml result file. Later, this result xml file can be used in Jenkins to provide functional tests statistics. In this case, we need an additional module into the reporting sections: reporting: - module: console - module: final-stats summary: true percentiles: true failed-labels: false test-duration: true dump-csv: TaurusResult/perf_result_csv.csv - module: junit-xml data-source: pass-fail filename: TaurusResult/junit-result.xml The last and most convenient and detailed reporting option is by integrating with the‘blazemeter.com’ service. The CA BlazeMeter integration provides very user-friendly and detailed graphs within the great user interface experience. First visit https://www.blazemeter.com/ and create your own account. Then, go to the ‘Settings’ -> ‘API Key’ and copy the specified key. There are two ways to specify this BlazeMeter API key for your reporting. You can either do it in YAML script, which is not secured, or create a ‘.bzt-rc’ file in your home folder and put the config in it: modules: blazemeter: token: <Put your token here> After that, add a module under the reporting section with appropriate information. Your reporting section will look like this: reporting: - module: console - module: final-stats summary: true percentiles: true failed-labels: false test-duration: true dump-csv: TaurusResult/perf_result_csv.csv - module: junit-xml data-source: pass-fail filename: TaurusResult/junit-result.xml - module: blazemeter report-name: Taurus test report test: Taurus test project: Taurus test project With this configuration, you will be automatically redirected to the CA BlazeMeter service, where your test execution is running.
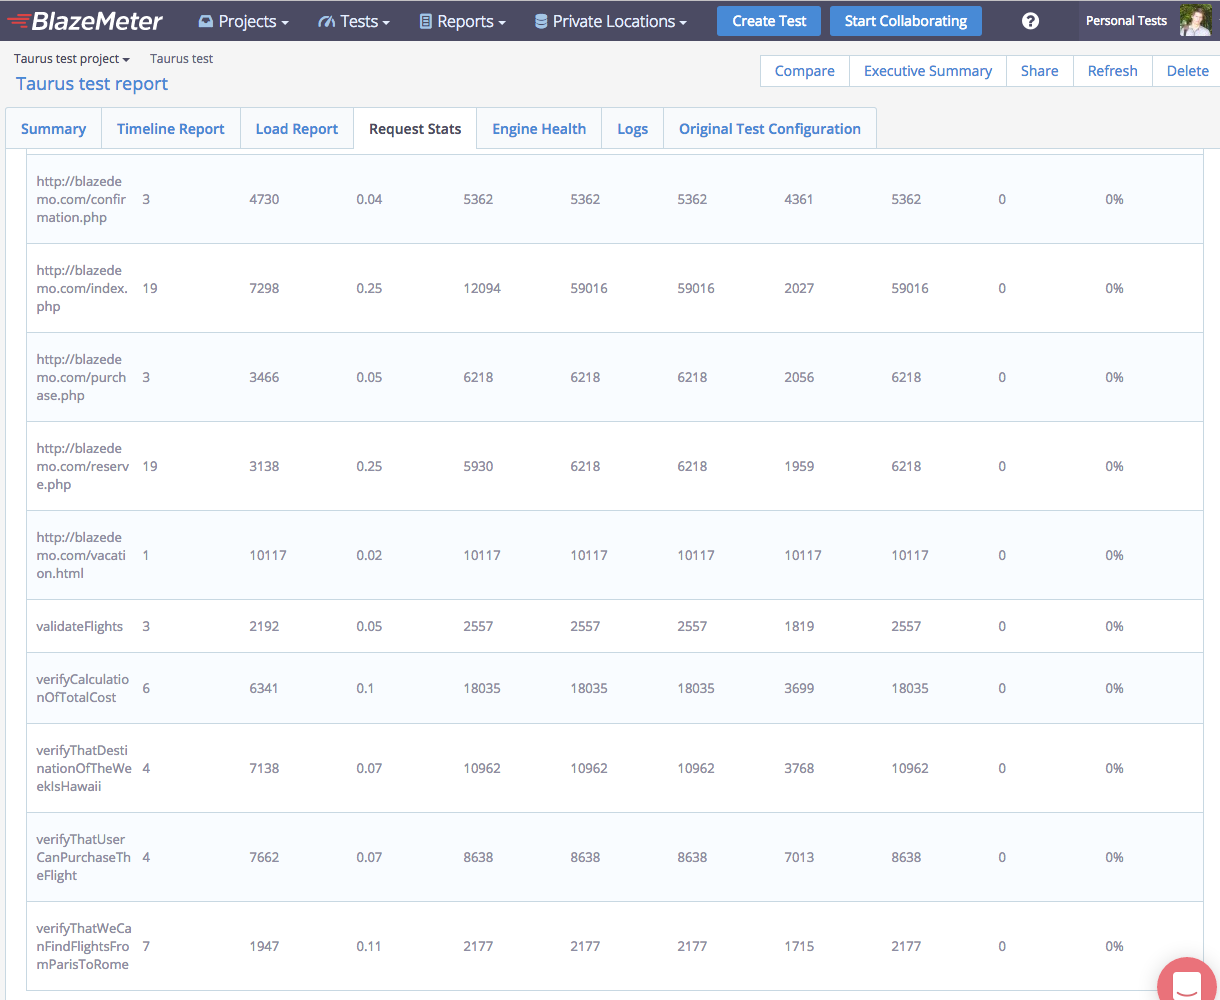
By using the CA BlazeMeter web tool you can create and analyze detailed graphs with detailed performance metrics per each test script:
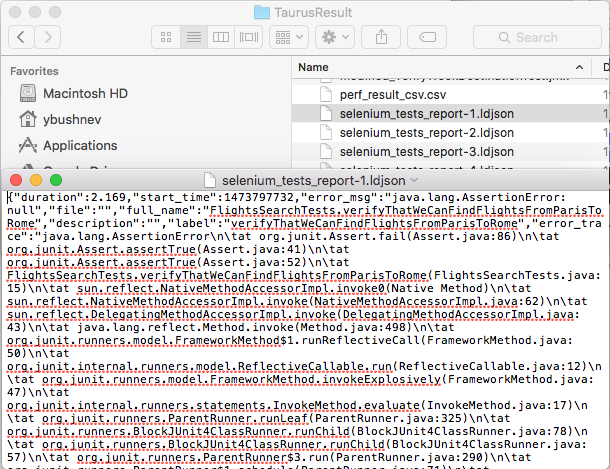
We also recommend you specify the locations of artifacts into your YAML file: settings: artifacts-dir: TaurusResult We will need to go through artifacts if we have issues, like failures in our Selenium tests. These issues will be immediately shown in our console reporting (red entries):
Then we can go into the artifacts folder and find junit logs in ‘junit.err’ and ‘junit.out’ files, as well as Selenium logs in the ‘seleniumtestsreport.ldjson’ file.
Congratulations! You now know how to create and read Taurus analytics reports. Stay with us for the next article, about integrating Taurus with Jenkins. The Taurus team is open for feedback and suggestions, ask for help with any issues via GitHub Issues. |
On this page:
|